Performance of the HSC Blue Oceans MDA
Our investment research is offered through the Harbourside Capital Blue Oceans MDA. Performance data is available by clicking on the link below.
WHOLESALE STRATEGY
The Wholesale Strategy is a high-conviction portfolio comprising the world’s best performing sustainable companies.
We remain invested for as long as our analysis indicates those companies remain high-quality. We know we are invested in the world’s best opportunities because we scan every listed company every three months. The Wholesale Strategy is open to Wholesale investors only.
Our Potential to Outperform
Our strategies aim to outperform the market over the long-term, driven by four key factors:
- As the businesses we are invested in mature, we recycle that capital into new emerging growth investments.
- Business models we are invested in have strong, long-term tailwinds because they are at the forefront of sustainable change required by humanity.
- Humanity is constantly evolving to meet new challenges. Our processes will continue to uncover high-quality companies meeting those challenges and we will invest in those opportunities at fair or discounted prices.
- Attempts to consistently predict market movements are impossible. We do not take a market or macro-economic view and move in or out of cash depending on that view. We hold high-quality companies for as long as our analysis can confirm they are high-quality. This allows our portfolio’s performance to closely resemble that of its underlying businesses.
Case Studies
| Period | Blue Oceans | MSCI World Leaders ESG |
|---|---|---|
| FY17 | 19.81% | 13.54% |
| FY18 | 49.42% | 7.75% |
| FY18 | 58.24% | 5.94% |
| Q1 FY20 | 9.86% | 0.36% |
“Blue Oceans Performance compared to MSCI World Leaders ESG Index” The MSCI index is made up of companies with high Environmental, Social and Governance performance. For more information on the index click here.
Risk
How have those results been achieved?
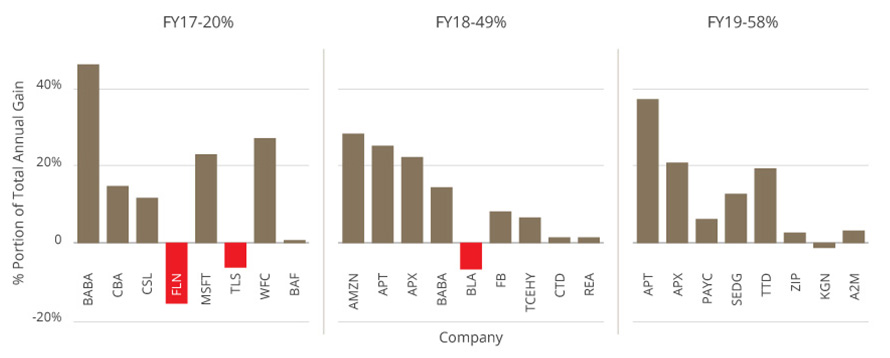
Portion of Total Annual Gain

Chart One. Portion of total annual gain by company.
Chart One above shows each investment over the three years and its contribution to gain in net asset value for the year. There have been a total of 25 investments over the three years. During that time our investment philosophy and methodology has developed which led to the sale of some investments. The case studies below highlight learnings from investment failures Freelancer (FLN), Telstra (TLN), & Blue Sky Alternatives (BLA) as well as highlight a range of our current investments The Trade Desk (TTD), Solar Edge (SEDG), A2 Milk (A2M), and Paycom (PAYC).


